Career Project
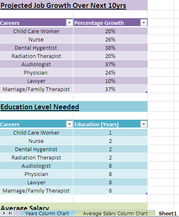
In this assignment we used Excel to create a table using the data we collected from our career exploration project. The skills I used was taking information like the average salary, education level needed, and the projected job growth over the next ten years. I then used the data and turned it into an organized chart. What I learned was how it is much easier to have a graph to you can compare each career to eachother and pick the best one. What I did well was organizing the chart so it is easy to read and easy to understand. I did this by color coding the data and by making the headings in bold. What I would do differently is pick different careers because after making the charts some careers I now have no interest in.
In our gloster assignment we had to create an internet poster about the careers we have chosen to go into. The skills I used while creating my glog where how to add videos and link websites to my information. What I learned was how to create a fun poster online after creating an account. What I did well was choosing the best information to put onto my glog. What I would do differently if I was to create a new glog about Radiation Therapy, would be to create a different layout and organize the information differently.
Multimedia Reflection
I learned using my smart phone that I can create videos and than edit them from my phone or computer. In the future I can use these tools to create projects for other classes in have or as a fun way. Multimedia is a great thing to learn because you can always use it.
